The supply of Westside detached homes in March was 684, down 4% from 713 in February and down 11% compared to 772 in March 2018.
Westside detached home sales this March were up 44% from February (62 from 43) and up 17% compared to 53 sales in March 2018. But even though March sales are up from last month and last year, they are still down 61% from the 10 year March average of 158 sales.

Months of Supply, (MOS) was down 34% from last month to 11 and down 24% from 15 in March 2018. (Usually a balanced market is in the range between 4-7 MOS with prices rising below 4 MOS and falling above 7 MOS). This downward trend in MOS has caused the average detached home price to increase 4% to $3.104M and the median price to increase 3% to $2.8M. However the price increases are not sustainable. If demand stays low, MOS will stay high and we should see downward pressure on prices. Current prices are still down 32% on average & 27% on median from the peak in 2017.
The highest sale price for a Westside detached home in March was $8.5M. It was on the market for 4 days before it sold. It was purchased in Oct 2017 for $9.35M. The lowest price was $1.61M. It was on the market for 236 days before it sold. Of the 63 March sales, 13 received the asking price or more and 49 sold below the asking price. The implication is that with a sufficiently attractive (low) asking price we can still generate multiple offers.


Westside apartment supply increased 13% to 1522 units from 1348 units in February and this is up 113% from the 716 listings we had in March 2018. At the same time, demand increased 26% to 235 sales in March from 180 sales in February and this is down 33% from 349 sales in March 2018.
The result is MOS in March is down 11% to 6.5 from 7.2 in February and up 216% from 2 last March 2018.
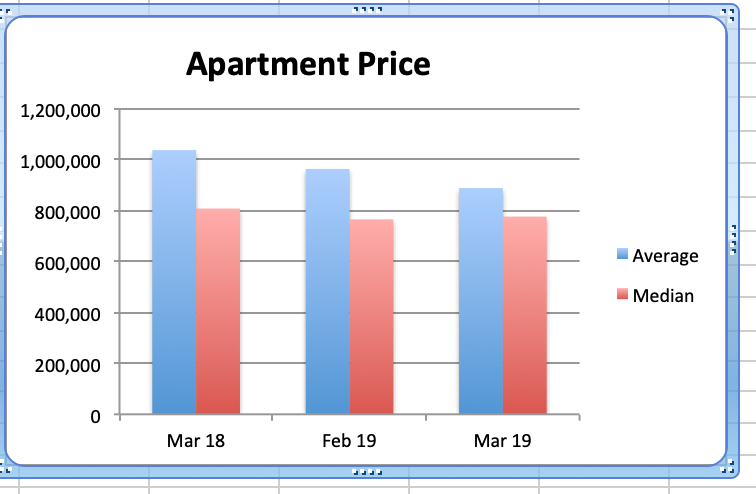
The average price decreased 8% to $886K from $962K in February and was down 14% from March 2018. The median price increased 1% to $775K from $764K in February and is down 4% from last March. Both average and median prices are down by 26% & 12% from the peak of $1.199M and $880K in January 2018.


Westside townhouse supply increased 10% this March to 272 homes from 248 in February and that's up 57% from 173 in March 2018. Demand in March is up 36% to 34 sales from 25 in February and down 13% from 39 sales last March 2018.
With both supply and demand up, the current MOS decreased to 8 from 9.9 in February but that is an increase of 80% from 4.4 in March 2018.
Townhouse average prices remained almost unchanged ($1.38 v $1.368K) and were down 12% from $1.575M last March 2018. Median prices increased 6% to $1.163M from $1.099M in February and are down 24% from $1.538M in March 2018.
As with apartment prices, townhouse prices are down 23% (average) and 23% (median) from the peak prices last January 2018.


Detached, Attached and Apartments on the west side are still experiencing price reductions and that is creating good buying opportunities. Many buyers continue holding off in anticipation of further declines in 2019.
The Real Estate Board of Greater Vancouver (REBGV) reports that residential property sales in the region dropped 31.4% to 1,727 this March from 2,517 sales in March 2018. March sales were 46.3% below the 10-year March sales Average.
The total number of properties currently offered on the MLS® system in Metro Vancouver is up 52.4% from March 2018 to 12,774.
For all property types, the sales-to-active listings ratio for March 2019 is 13.5%.
Downward pressure on home prices occurs when the ratio dips below the 12% mark for a sustained period, while upward pressure occurs when it surpasses 20% over several months.
Currently, most older homes are selling well below assessed value even with the new assessments. Newer or unique homes are selling around assessed value and slightly higher.
The reduced demand we are seeing is due in a large part to political interference from all 3 levels of government and include increased taxes, lending constraints and bureaucratic delays and red tape. These impediments to real estate buyers and sellers are doing nothing to create more affordable housing or to increase the supply of rental housing. The need for shelter does not go away and Vancouver remains a desirable place to live so stifling buyers with these policy changes is merely delaying local demand and disrupting the real estate cycle that was already into a downturn of its own accord.
The bottom line is that listing supply is increasing, buyers are waiting eagerly for further declines and sales are well below 10 year averages.
Click on the links at the top right of the newsletter for all the Westside Graphs.
Please call me at any time for a considered response to any and all of your real estate questions.
Best regards,
Stuart
